My Longevity Journey
Blood, Biomarkers, and Beach Miles

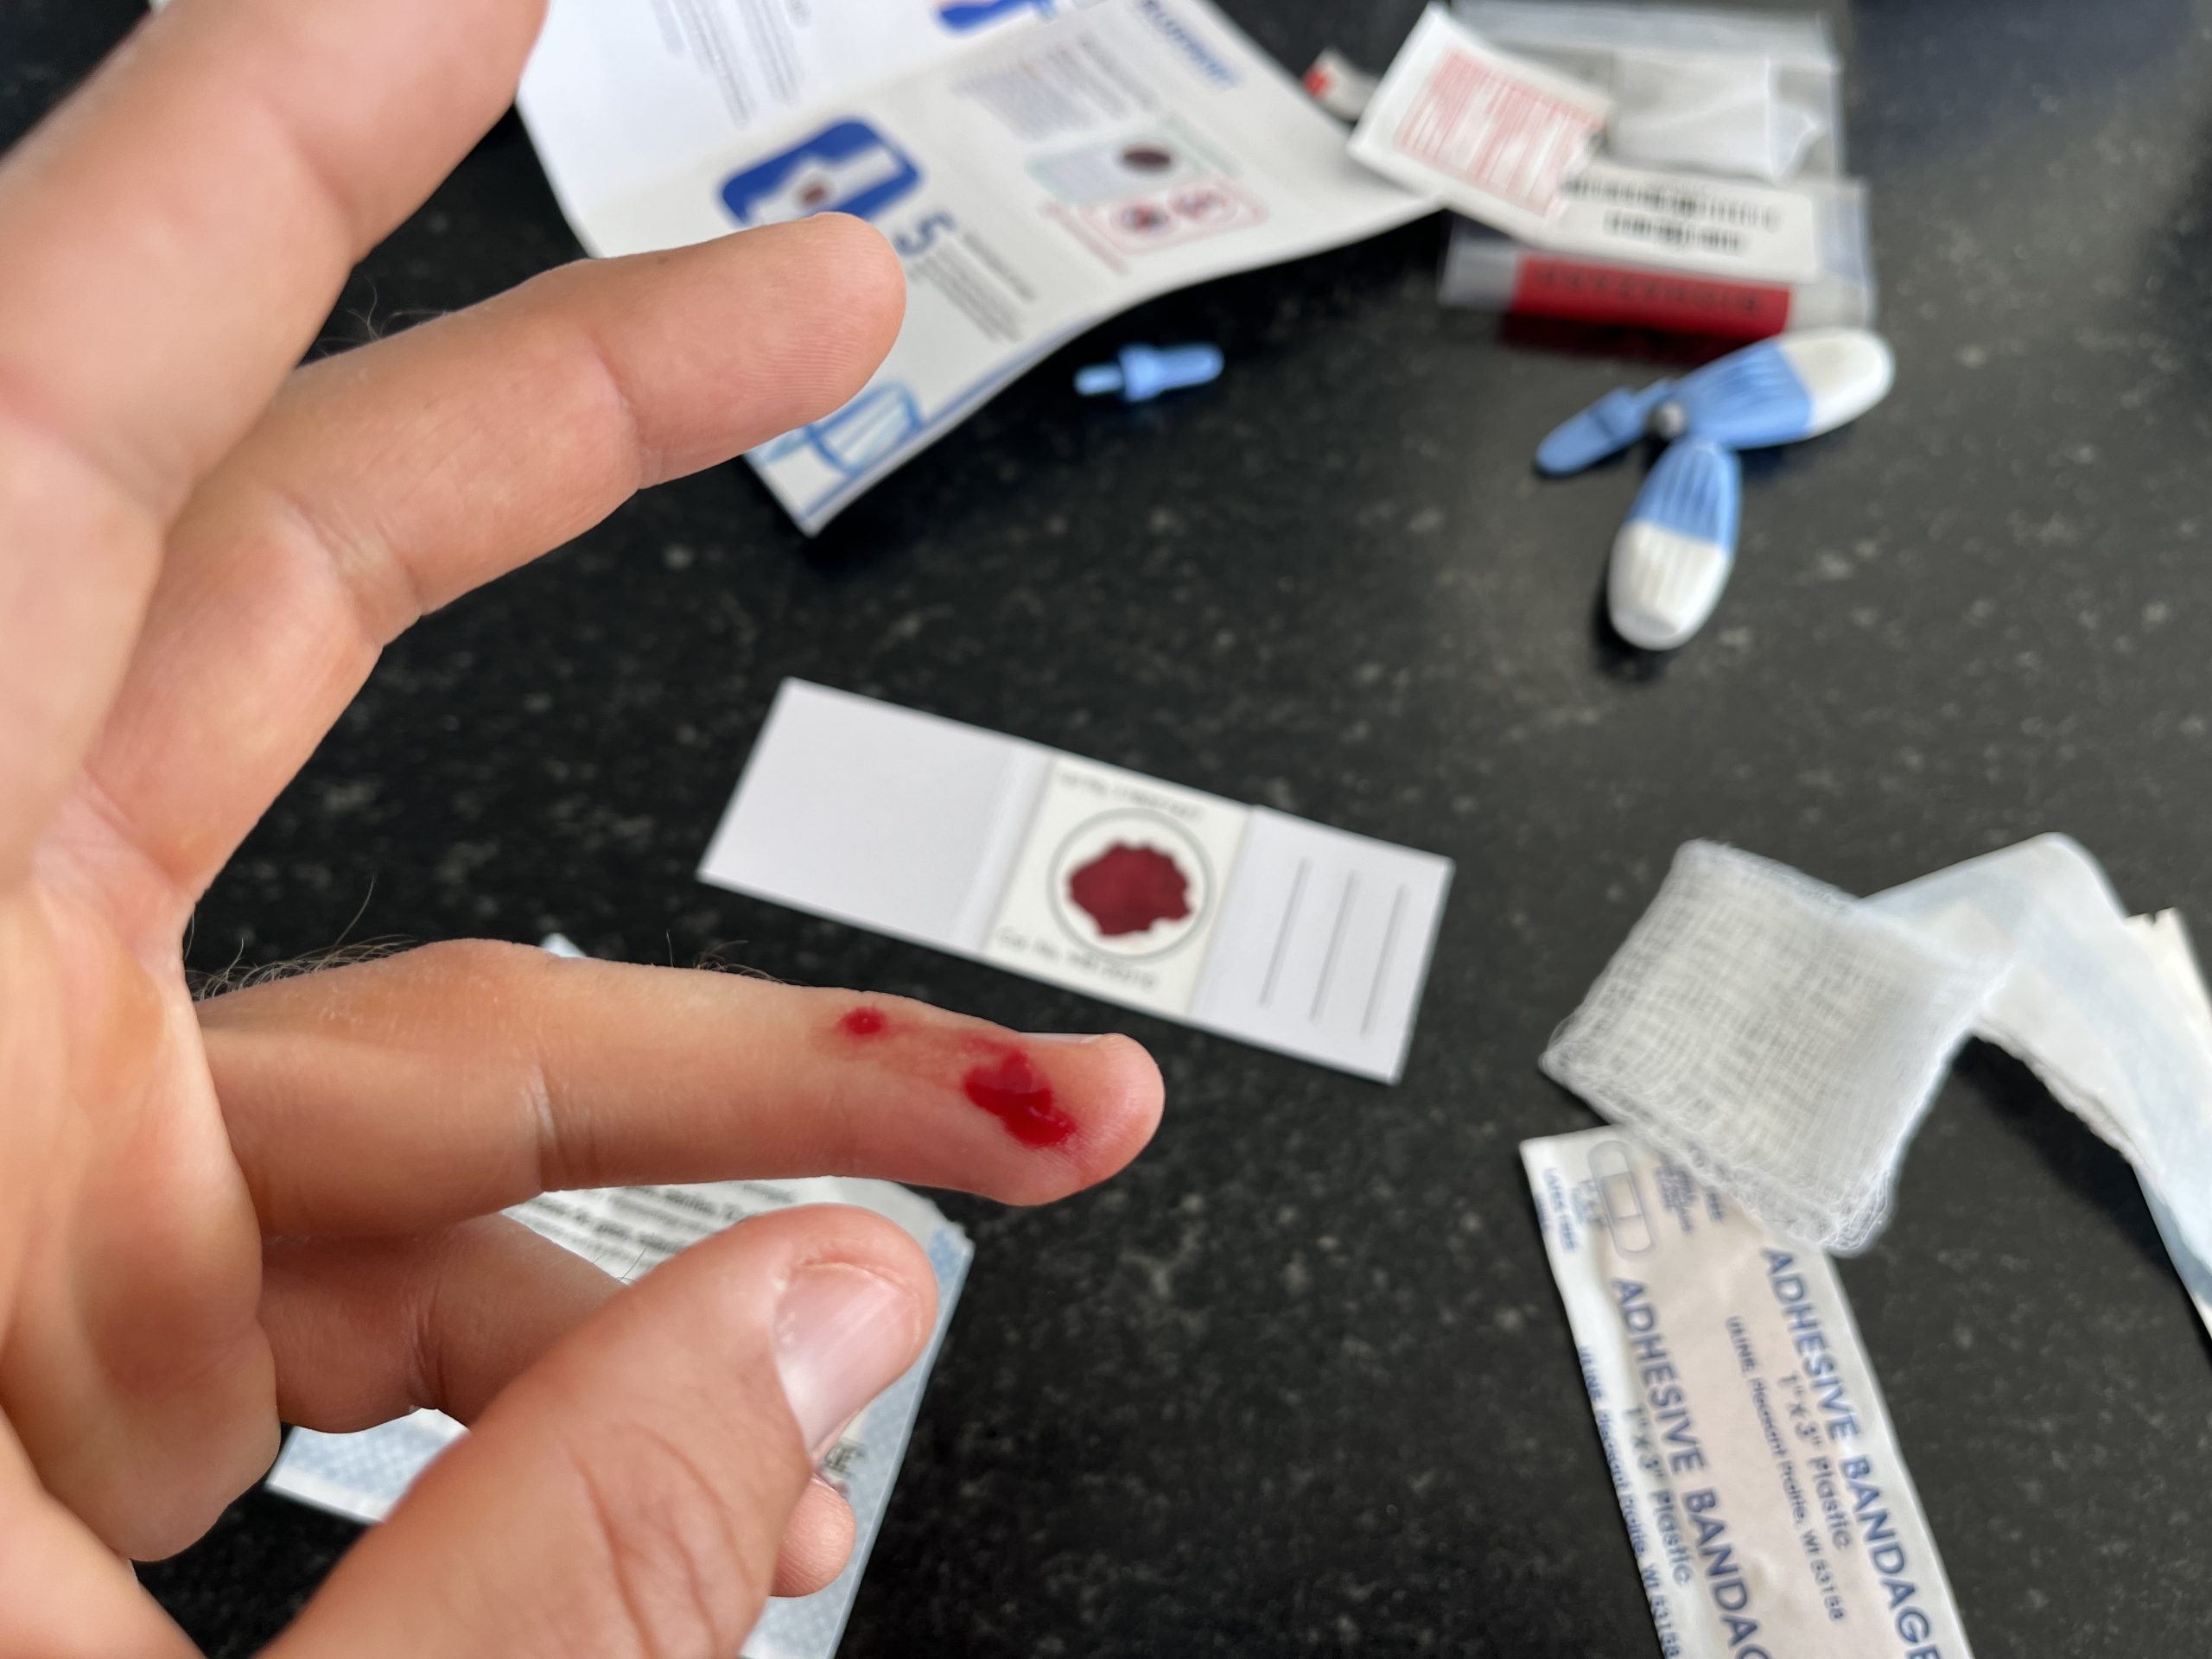
An eighteen hour fast, fifteen vials at Quest Diagnostics, a brave little finger prick at home, and two runs that turned a science day into a victory lap.
Today, I turned my body into a friendly neighborhood research lab. Two blood tests, one long fast, a slightly dramatic amount of vials, and enough running to make my future self very proud. If you’ve ever wondered what it feels like to chase biomarkers in the morning and chase endorphins by sunset, welcome to my day.
Mission One: Function Health at Quest Diagnostics
I kicked off the morning fasted for about 18 hours and headed to Quest Diagnostics for my Function Health labs. According to the Function Health site, I expected around 10 to 12 vials.
The technician had other plans.
15 vials later, I’m sitting there thinking, wow, that is a lot of little tubes for one human. The whole process was quick and smooth, though. It started with a urine sample, then the blood draw. Unlike the Blueprint Advanced Panel I did a year ago at Lab Corp, this time they didn’t use a butterfly needle, which makes it feel like one clean, easy poke. Nevertheless, the technician was gentle today and it took about 5 minutes for sample collection.
This panel is supposed to cover a huge spread of categories, including autoimmunity, blood, electrolytes, male health and hormones, heart health, heavy metals, immune regulation, kidney, liver, metabolic, nutrients, pancreas, stress and aging, thyroid, and urine. Very similar to the Blueprint Advanced Panel, but not entirely the same.
I grabbed this test for $365 on Black Friday (referral link), and I also bought it for my whole family as a kind of health snapshot gift. Function says results show up in about four weeks. Based on my past experience with other testing, I’m secretly hoping I’ll start seeing some numbers pop up over the weekend!
Mission Two: Blueprint Speed of Aging test at home
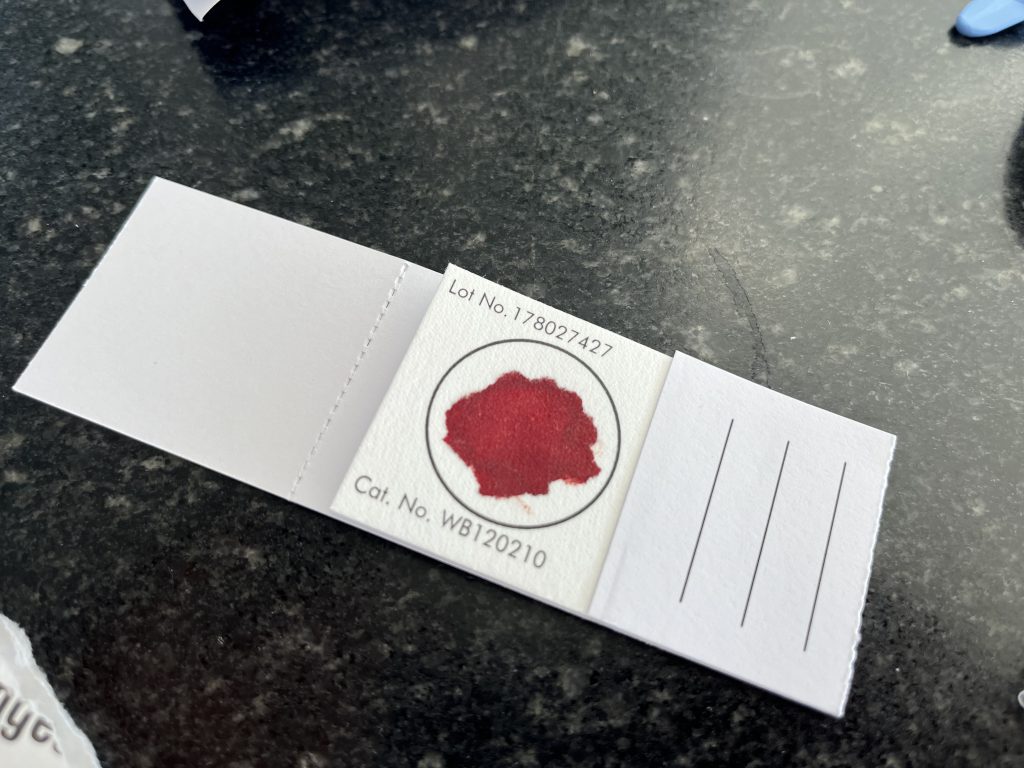
After Quest, I came home, broke the fast with oatmeal, and had green tea, plus a glass of electrolyte lemonade (yummy!). Then it was time for the at-home Blueprint Speed of Aging test developed by TruDiagnostics.
They ship a kit with everything you need. Two spring-loaded lancets, alcohol wipe, gauze, bandage, and the sample card where you blot your blood into a printed circle. In the photo above, you can see the card with that red circle filled in. It looks oddly official, like a tiny passport stamp from the land of longevity.
Before I left Quest, I asked the technician which finger gives the best blood flow, because last time I did this I had to poke my finger twice and that wasn’t fun! She recommended the side of the ring finger and told me to make sure my hands were warm.
Armed with that advice, I set up my little station on the counter, swabbed my ring finger, got the card ready, and stared at the lancet like it was a tiny plastic jack-in-the-box.
I will say this with confidence. I much prefer someone else drawing blood from my arm over me pressing a spring-loaded button and waiting for the pop. The anticipation is genuinely the scariest part. It’s like your nervous system knows what’s coming and politely requests an alternative plan.
Pop.
Blood started flowing. I wiped the first bit with gauze, then got to work blotting the card until the circle was mostly filled and it started showing through the other side. I snapped a photo, which captures the moment pretty good. Blood on my fingertip and the kit scattered around like a miniature crime scene, except the suspect is me and the motive is better data.
After that, it’s now a waiting game. I let the card dry for three hours, sealed it in the biohazard bag, and packed it into the envelope to mail back to the lab.
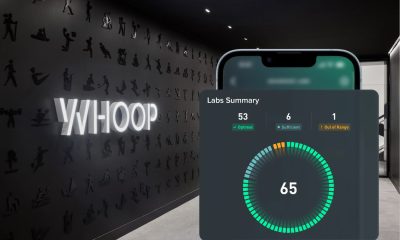
This is the test I’m most excited about. I expect my broader labs to be pretty consistent with the WHOOP Advanced Labs I did at the end of last year. But the Speed of Aging number is the one I’m watching like a hawk. In January of 2025, it came back at 29.1 years old, about fifteen years younger than my chronological age. Since then, I’ve drastically changed my diet, exercise, and sleep, so I’m eager to see whether that number holds, improves, or humbles me. As of today, my WHOOP Age stands at 30.8 years old with a pace of aging of 0.70.
The Victory Lap: Training to Celebrate the Data
Once the science portion of the day was handled, I did what I love most. I moved.
First, a 4 mile run on the treadmill in the gym, about 30 minutes, just in case I passed out from the blood work I’d be close to home! I spent about 15 minutes in Zone 4 with an incline of 4.0 and a pace of 7.8 MPH. Then I refueled with my spinach protein smoothie with olive oil, plus about 3 cups of broccoli, cauliflower, and carrots.
After that, I headed out for a 6.4 mile run along the coast, letting the ocean air do what it always does, clear my head and smooth out the edges of the day. Next up is a little light lifting, dinner, and then the best kind of recovery combo, a sauna and a long soak in the jacuzzi. Data collected, miles logged, body cared for. That’s a good day! 🙌
🩺 Disclaimer
The content on I Won’t Die is for informational and educational purposes only. It is not a substitute for professional medical advice, diagnosis, or treatment. Always consult a qualified healthcare provider with any health concerns.
🚀 Get Started with Blueprint
Start optimizing your health today with $25 off your first order! Use our referral code to begin your Blueprint journey and take control of your longevity.
🏋️♂️ Track Your Sleep, Workouts & Recovery
Boost your performance and recovery with Whoop. Join with my referral link to get a free WHOOP 5.0 and one month free!
📲 Download the I Won’t Die App
Stay ahead with the latest news, updates, and insights. Download the I Won’t Die app now on the Apple App Store and Google Play!
📩 Contact Us
Have tips, photos, or questions? Want to collaborate? Reach out at [email protected] — we’d love to hear from you!
🔗 Stay Connected
Follow us on Don't Die, Facebook, X, Instagram, YouTube, and LinkedIn for Blueprint longevity and Bryan Johnson updates.
📬 Subscribe to I Won’t Die Newsletter
Get the latest longevity breakthroughs, Blueprint updates, and exclusive content straight to your inbox — sign up now!
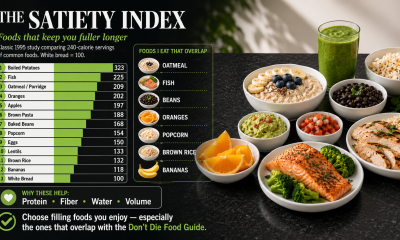


Satiety may be the underrated longevity hack hiding in plain sight when the foods you enjoy also happen to keep you full and align with the Don’t Die Food Guide.
This morning, it hit me. I have a new theory about dieting.
Maybe one of the best longevity diets is not the one that makes you suffer the most.
Wild concept, I know. Hahaha!
Maybe the best diet is built around foods that are nutrient-dense, filling, repeatable, and enjoyable enough that you can actually eat them every day without feeling like you are being punished by a spreadsheet.
That is where the Satiety Index gets interesting.
Last year, when I began intentionally choosing what I put into my body, I kept hearing about the Satiety Index. Nearly 30 years ago, researchers compared 240 calorie servings of 38 common foods and ranked them by how full they made people feel compared with white bread.
And honestly, that tracks.
Some foods leave you satisfied. Others leave you wondering what else is in the kitchen.
Some foods are just better at turning calories into fullness. They stretch further. They slow you down. They tell your brain, “We are good here.”
When I looked at my own diet, I realized something funny.
A lot of the foods I already eat every day are either in the Satiety Index or behave like high-satiety foods because they are loaded with fiber, water, protein, and volume.
Even better, many of them overlap with the broader Don’t Die Food Guide style of eating: whole foods, legumes, vegetables, berries, fruit, clean protein, healthy fats, and food that looks like it came from the earth instead of a factory.
That feels like a pretty good place to live.
My Current Diet Is Basically A Satiety Experiment
Most days, my weight bounces between 155 to 160 lbs. This morning it was 157.6 lbs.
That range has been surprisingly steady considering how much I eat.
Breakfast is usually 1 cup of oatmeal with a mashed banana, almond milk, and either peanut butter powder or raisins.
Lunch is a giant plant-heavy meal: 3.5 cups of broccoli, cauliflower, carrots, and a smoothie with 8oz of spinach, 1 cup of blueberries, 4 scoops of Orgain protein powder, 2 tablespoons of olive oil, and water.
Dinner is usually salmon, tilapia, or chicken with 1 cup of black or pinto beans, 1 cup of brown Mexican rice, salsa, and two avocados mashed into homemade guacamole.
Dessert is often a few oranges or maybe some berries.
Sometimes I add homemade popcorn with either a light amount of olive oil or avocado oil spray and salt.
When I estimated the full day, it probably lands somewhere around 3,300 to 3,500 calories on a normal day, and more on popcorn days.
For many people, that would be a lot.
For me, because I run a lot, lift weights, walk, and generally move like I am trying to win an invisible step count war against biology, it seems to balance out.
The diet and exercise meet in the middle.
The Satiety Index Foods I Actually Eat
Here are some of the big ones in my diet that show up in the Satiety Index or closely match foods that do.
Oatmeal
Oatmeal scores very high for satiety. That makes sense. It is slow-digesting, high in soluble fiber, and feels like it actually lands in your stomach.
This is why I like it as a breakfast anchor. It does not feel like a diet food. It feels like real food.
Add a banana, almond milk, and peanut butter powder, and it becomes a breakfast that is simple, filling, and repeatable.
Fish
Fish is one of the highest satiety foods in the index.
Tilapia is lean and high-protein. Salmon brings protein plus omega-3 fats. Chicken works well too, even though it was not part of the original Satiety Index in the same way.
For me, the protein at dinner is key. It turns the meal from “a bowl of carbs and plants” into something that supports muscle, recovery, and fullness.
Beans
Beans are a longevity cheat code.
Black beans and pinto beans give me fiber, plant protein, slow carbs, and a lot of fullness per calorie. They also fit perfectly with the kind of Mexican-style meals I actually enjoy eating.
That part matters.
A food can be healthy, but if I do not want to eat it, it is not a protocol. It is a temporary hostage situation.
Beans are different. I actually like them. A lot!
Oranges
This one surprised me.
Oranges score really well for satiety, but when you think about it, it makes sense. They are sweet, juicy, high-volume, and take a little time to eat.
As a dessert, they are kind of perfect.
They give me the sweet finish without turning dessert into a nightly processed-food detour.
Popcorn
Popcorn is one of my favorite examples of how preparation changes everything.
Air-popped or lightly sprayed popcorn can be a high-volume, high-satiety snack.
Popcorn drowned in oil is basically a movie-theater calorie ambush.
At home, using avocado oil spray and salt keeps it much more reasonable. It still feels like a snack, but it does not blow up the whole day.
Banana
Bananas are not the highest-satiety fruit, but they work well in oatmeal.
For me, the banana is less about being the perfect satiety food and more about making oatmeal enjoyable enough to eat consistently.
That is still a win.
The Don’t Die Overlap
This is where the whole thing gets practical.
The goal is not just to eat filling food.
A giant bowl of random processed diet food might fill you up, but that does not mean it supports healthspan.
The better target is overlap.
Find foods that are:
- Filling
- Nutrient-dense
- Minimally processed
- Easy to repeat
- Enjoyable
- Aligned with long-term health
That is the sweet spot.
For me, that overlap includes oatmeal, beans, vegetables, berries, oranges, fish, chicken, spinach, brown rice, salsa, and homemade popcorn.
Then there are the calorie-dense foods I still love, especially avocados and olive oil.
Avocados are not “light,” but they are full of fiber, potassium, monounsaturated fat, and satisfaction. Olive oil is not especially filling per calorie, but it fits the Mediterranean-style pattern I like.
The key is knowing the difference.
Some foods are satiety engines.
Some foods are nutrient-dense calorie boosters.
Both can belong in the diet, but they play different roles.
Why This Helps Me Maintain Weight
I think this is why my weight stays relatively steady between 155 to 160 lbs.
I am not eating tiny meals.
I am not starving or hungry.
I am not trying to survive on protein dust and sad lettuce.
I am eating a lot of food, but most of it is food that fights back against overeating.
Vegetables create volume.
Beans bring fiber and slow carbs.
Protein keeps me full and supports recovery.
Oatmeal gives me a strong breakfast base.
Oranges handle dessert.
Popcorn gives me a snack that feels fun without being ridiculous.
And because I actually enjoy these foods, I do not feel like I am constantly negotiating with myself.
That may be the real secret.
The best food plan is the one you can keep doing when nobody is watching.
My Rule Going Forward
Here is the simple takeaway:
Choose foods in the Satiety Index that you actually enjoy eating, then prioritize the ones that overlap with the Don’t Die Food Guide.
That is the game. Not perfection, suffering or chasing every new diet or longevity food trend that shows up on social media.
Just build the plate around foods that fill you up, nourish your body, and make consistency feel almost automatic.
For me, that means oatmeal, beans, fish, vegetables, oranges, berries, popcorn, salsa, and yes, plenty of guacamole, because apparently the secret to not dying might include eating foods you actually like.
Nom nom nom 😋
🩺 Disclaimer
The content on I Won’t Die is for informational and educational purposes only. It is not a substitute for professional medical advice, diagnosis, or treatment. Always consult a qualified healthcare provider with any health concerns.
🚀 Get Started with Blueprint
Start optimizing your health today with $25 off your first order! Use our referral code to begin your Blueprint journey and take control of your longevity.
🏋️♂️ Track Your Sleep, Workouts & Recovery
Boost your performance and recovery with Whoop. Join with my referral link to get a free WHOOP 5.0 and one month free!
📲 Download the I Won’t Die App
Stay ahead with the latest news, updates, and insights. Download the I Won’t Die app now on the Apple App Store and Google Play!
📩 Contact Us
Have tips, photos, or questions? Want to collaborate? Reach out at [email protected] — we’d love to hear from you!
🔗 Stay Connected
Follow us on Don't Die, Facebook, X, Instagram, YouTube, and LinkedIn for Blueprint longevity and Bryan Johnson updates.
📬 Subscribe to I Won’t Die Newsletter
Get the latest longevity breakthroughs, Blueprint updates, and exclusive content straight to your inbox — sign up now!
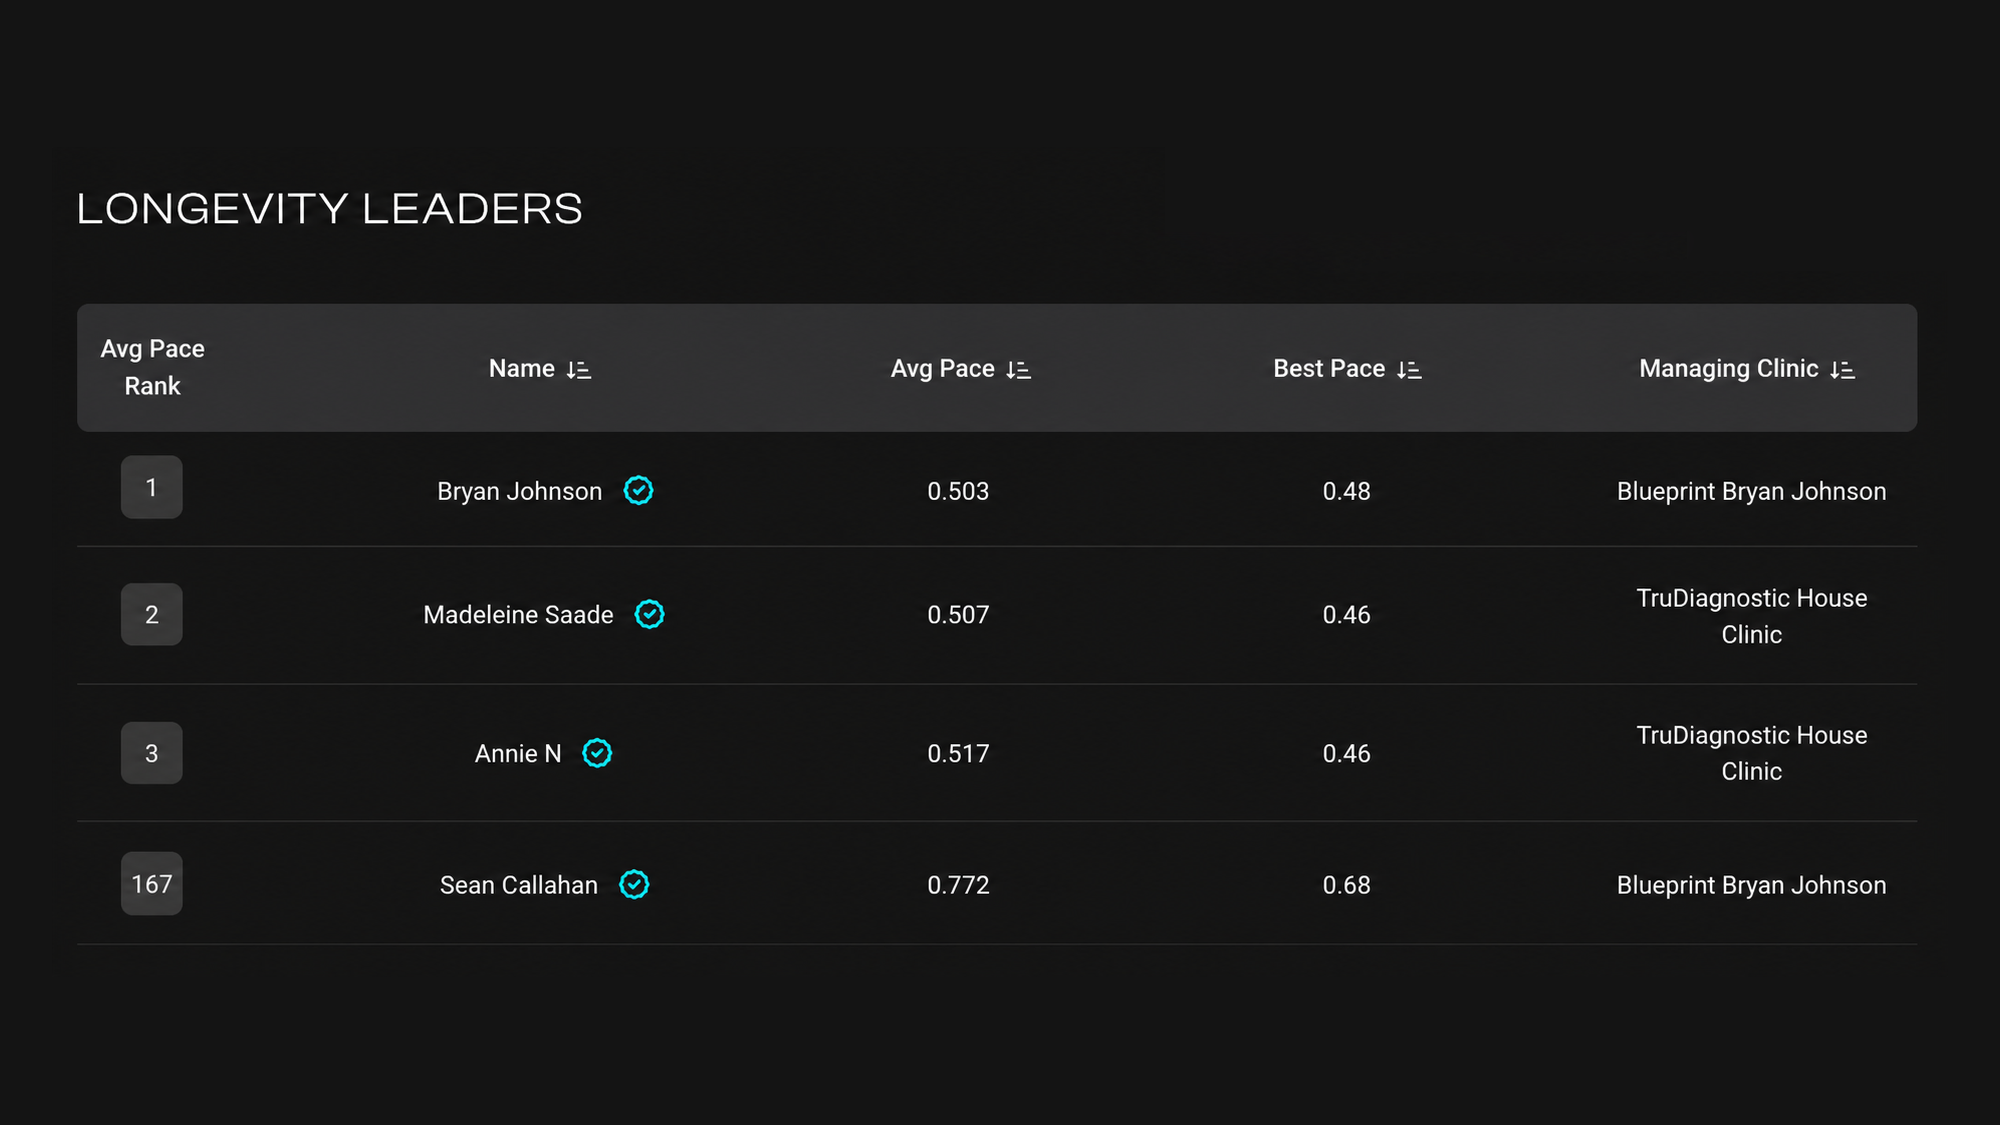
My verified 0.77 pace of aging puts me on the longevity leaderboard and Bryan Johnson remains just 166 spots ahead, for now.
Today, I have officially entered the Olympics.
Not the kind with a marathon, sprinting, swimming, or an opening ceremony.
This is the Rejuvenation Olympics, where people compete to see who can age the slowest.
Apparently, running about 7 miles and weightlifting every day was only the warm-up.
I’m Ranked #167
After completing three Blueprint Speed of Aging tests, my results are now verified on the Rejuvenation Olympics leaderboard.
My official ranking is:
#167
My average pace of aging is listed at approximately:
0.77
My best result is:
0.68
That means my best test suggests my biology was aging at roughly 68% of the expected rate.
For perspective, Bryan Johnson currently sits at #1 with an average score of 0.503 and a best score of 0.48.
So yes, I am officially competing against Bryan Johnson.
He is just 166 places ahead of me.
I assume the Olympic committee is already preparing the podium. 🏆😂
How My Score Was Calculated
The Rejuvenation Olympics does not use one lucky test result. A verified ranking requires at least three qualifying tests.
My average was calculated using these results:
- 0.95
- 0.69
- 0.68
Together, they produce an average of approximately 0.77.
That first score of 0.95 is doing some serious damage to my ranking. Without it, Bryan might need to start checking over his shoulder.
Okay, probably not yet, but it does show why repeated testing matters. One great result can be exciting. Multiple results begin to reveal whether the change is real and sustainable. And a pattern can be shown over time as in my case.
What Is the Rejuvenation Olympics?
The Rejuvenation Olympics is a public longevity competition built around biological aging data.
Participants use TruDiagnostic testing to measure DunedinPACE, an epigenetic marker designed to estimate how quickly the body is aging. Lower scores are better.
A score of 1.0 suggests the body is aging at roughly the expected rate. A result below 1.0 suggests slower biological aging.
The leaderboard ranks people using the average of their best three eligible tests. To receive a verified badge, participants must complete at least three qualifying tests.
Most people can enter through a TruAge subscription. I completed my testing through Blueprint, which is a participating clinic.
In other words, I did not wake up one morning and declare myself the 167th-slowest-aging person in the world.
There was paperwork involved and better yet, Blueprint did all of that when I opted into the Rejuvenation Olympics.
From 0.95 to 0.68
The ranking is fun, but the trend is what really matters to me.
My first result in January 2025 was 0.95. My most recent result came back at approximately 0.68.
That is a meaningful improvement in a little over a year.
During that period, I stayed consistent with the same basic routine:
- Mediterranean-style diet
- Daily cardio
- Strength training four to five days per week
- Better sleep and recovery
- Consistent supplements
- Regular testing and adjustments
There was no single miracle intervention.
It was mostly doing the boring things repeatedly until they became less boring and started appearing in my biomarkers.
Then WHOOP Made Things Confusing
My WHOOP data adds another twist.
My WHOOP Pace of Aging previously reached a low of -0.3x, which briefly suggested that I had discovered how to reverse time.
It has since risen to 1.1x.
That would normally suggest I am currently aging slightly faster than expected. At the same time, WHOOP still estimates my biological age at approximately 31, making me 15.5 years younger than my chronological age.
So am I aging slowly, aging quickly, or somehow doing both?
The honest answer is that I am not entirely sure.
WHOOP and DunedinPACE measure different things across different timeframes. WHOOP’s pace can move as recent sleep, fitness, activity, and recovery change. Its WHOOP Age reflects a broader physiological picture.
DunedinPACE uses DNA methylation to estimate biological aging at the cellular level.
These scores are interesting signals. They are not identical measurements, and they should not be treated as interchangeable.
That may explain why my WHOOP Pace of Aging can rise while my WHOOP Age remains low and my latest epigenetic result remains strong. Then again, perhaps my WHOOP Age is simply playing catch-up after falling so far below my chronological age.
Or my body may simply enjoy giving me more data to obsess over.
Am I Really the 167th-Slowest-Aging Person?
Not exactly.
This does not mean I am literally the 167th-slowest-aging human on Earth.
It means I currently rank #167 among verified participants using this specific testing method and leaderboard formula.
That is still pretty cool.
More importantly, it gives me a benchmark. I can continue testing, compare future results, and see whether my average improves.
The rankings may change daily. My position could move as new participants qualify and existing competitors submit new results.
For now, however, #167 is mine.
The New Goal
Bryan Johnson’s average is 0.503.
Mine is approximately 0.77.
That is a substantial gap, but longevity is a long game. Conveniently, that is the entire point.
My next goal is not to chase one spectacular result. It is to produce another strong test and replace that 0.95 score in my three-test average.
If I can do that, my ranking could improve significantly allowing me to break the Top 100.
The plan remains simple:
Stay consistent.
Protect recovery.
Keep training.
Keep testing.
And slowly climb a leaderboard dedicated to moving slowly.
Final Thoughts
When I started this longevity journey, the goal was not to win an internet competition.
I wanted to reduce cardiovascular risk, improve my biomarkers, feel better, and build a healthier future.
The leaderboard is simply a fun way to measure progress.
Still, becoming a verified Rejuvenation Olympics competitor feels like a meaningful milestone. My results are no longer just sitting inside a private health report. They are now part of a public competition involving people around the world.
I am ranked #167.
Bryan Johnson is ranked #1.
There are 166 people standing between us.
Game on. Hahaha! 🙌
🩺 Disclaimer
The content on I Won’t Die is for informational and educational purposes only. It is not a substitute for professional medical advice, diagnosis, or treatment. Always consult a qualified healthcare provider with any health concerns.
🚀 Get Started with Blueprint
Start optimizing your health today with $25 off your first order! Use our referral code to begin your Blueprint journey and take control of your longevity.
🏋️♂️ Track Your Sleep, Workouts & Recovery
Boost your performance and recovery with Whoop. Join with my referral link to get a free WHOOP 5.0 and one month free!
📲 Download the I Won’t Die App
Stay ahead with the latest news, updates, and insights. Download the I Won’t Die app now on the Apple App Store and Google Play!
📩 Contact Us
Have tips, photos, or questions? Want to collaborate? Reach out at [email protected] — we’d love to hear from you!
🔗 Stay Connected
Follow us on Don't Die, Facebook, X, Instagram, YouTube, and LinkedIn for Blueprint longevity and Bryan Johnson updates.
📬 Subscribe to I Won’t Die Newsletter
Get the latest longevity breakthroughs, Blueprint updates, and exclusive content straight to your inbox — sign up now!

My latest Function Health results suggest that longevity may be less about maximizing and more about balancing.
Last week my latest Function Health results arrived along with clinician notes, covering blood work collected on May 26, 2026. As usual, opening the report felt a little like getting a report card back from biology.
Some biomarkers improved.
Some stayed flat.
And a few unexpectedly moved in the wrong direction. 🤦♂️
This is now about 18 months into my serious longevity journey. Since January 2025, I’ve been intentionally improving sleep, nutrition, recovery, exercise, and biomarker tracking. I expected that with enough consistency, the numbers would just keep improving.
Biology, as it turns out, is more nuanced. Sometimes better health is not about pushing harder. It’s about finding the right balance.
The Big Picture: January 2025 → June 2026
Eighteen months into this journey, the biggest risks have largely moved into the rearview mirror, and the remaining work is about building resilience for the long game.
| Biomarker | Jan 2025 (Blueprint) | Jan 2026 (Function) | Jun 2026 (Function) | Longevity Take |
|---|---|---|---|---|
| ApoB (mg/dL) | 87 | 51 | 59 | Massive improvement, still elite |
| hs-CRP (mg/L) | 4.38 | 0.3 | <0.2 | Inflammation nearly eliminated |
| LDL-C (mg/dL) | 83 | 56 | 61 | Excellent cardiovascular risk |
| Triglycerides (mg/dL) | 113 | 74 | 60 | Metabolically elite |
| HbA1c (%) | 5.4 | 5.2 | 5.2 | Stable and optimal |
| Insulin (µIU/mL) | 2.4 | 5.2 | 2.2 | Exceptional insulin sensitivity |
| Omega-3 Index (%) | 3.1 | 8.4 | 7.3 | Dramatic improvement from baseline |
| Ferritin (ng/mL) | 55 | 32 | 31 | Lower than baseline, now stable |
| Homocysteine (µmol/L) | 11.1 | 7.1 | 9.1 | Meaningfully improved |
| Vitamin D (ng/mL) | ~50s | 57 | 70 | Excellent range |
| WBC (K/µL) | Normal | 3.2 | 3.4 | Mildly low but stable |
| Platelets (K/µL) | Normal-low | 131 | 129 | Stable, likely athlete pattern |
| DHEA-S (mcg/dL) | Not measured | 45 | 55 | Improved, still below optimal |
| LDL Particle Number (nmol/L) | 830 | 979 | 1166 | Worsened despite excellent ApoB |
| LDL Small (nmol/L) | N/A | 175 | 234 | Area for continued optimization |
| Biological Age | ~46 chronologic | 35.3 | 37.0 | Still ~9 years younger biologically |
Looking at the full picture, this is no longer a story about preventing disease. It is increasingly a story about balancing performance, recovery, and longevity.
The Good News First
Objectively, my health today is significantly better than it was in January 2025.
Inflammation has collapsed.
Cardiovascular risk markers have improved dramatically.
Metabolic health remains elite.
My ApoB is now 59 mg/dL. My hs-CRP is less than 0.2 mg/L. LDL cholesterol sits at 61 mg/dL. Triglycerides are 60 mg/dL. Insulin remains a remarkably low 2.2 uIU/mL.
Those are the kinds of numbers I hoped to achieve when this journey began.
Even my Omega-3 status, while lower than earlier this year, remains far better than where I started.
The Surprising Part
A few markers regressed despite doing almost everything the same.
Between January and May 2026, I made virtually no dietary or supplement changes. The biggest lifestyle change was exercise.
In 2025, I averaged roughly 5 miles of running per day.
From January through mid-February 2026, I increased that to nearly 10 miles per day.
Since then, I have averaged around 7 miles per day while continuing my weightlifting routine.
The result?
Some lipid particle markers worsened.
| Biomarker | January 2026 | May 2026 |
|---|---|---|
| LDL Particle Number | 979 | 1166 |
| LDL Small | 175 | 234 |
| LDL Medium | 182 | 244 |
| HDL Large | 6763 | 5816 |
| LDL Pattern | B | B |
| LDL Peak Size | 215.6 | 216.4 |
At first glance, that was frustrating.
After all, shouldn’t more exercise always equal better biomarkers?
Maybe not.
Have I Reached Diminishing Returns?
The more I look at these results, the more I wonder if I have crossed from “healthy exercise” into “elite endurance training.”
There is a difference.
Exercise is one of the most powerful longevity interventions we know of, but like many things in biology, the dose matters.
Based on the clinician notes, and the help of AI tools, my body is showing several signals that recovery demand may be approaching or exceeding recovery capacity:
- Ferritin remains below optimal.
- White blood cells remain mildly low.
- Platelets remain mildly low.
- DHEA-S remains low.
- Omega-3 levels declined.
None of these findings concern me individually. Together, though, they tell a story.
The story may simply be this:
I may be training harder than my body needs for optimal longevity.
The Ferritin Story
One biomarker I have been watching closely is ferritin, the body’s iron reserve.
In January 2025, my ferritin was 55 ng/mL. By late 2025, after increasing my running volume, following the Don’t Die Food Guide, eliminating red meat, and maintaining regular sauna sessions, it had fallen to 18 ng/mL.
My latest test came back at 31 ng/mL.
| Date | Ferritin (ng/mL) |
|---|---|
| January 2025 (Blueprint) | 55 |
| November 2025 (WHOOP Advanced Labs) | 18 |
| January 2026 (Function Health) | 32 |
| May 2026 (Function Health) | 31 |
At first glance, that looks discouraging, but the story is more nuanced.
Ferritin does not exist in isolation. Endurance athletes lose iron through sweat, foot strike hemolysis, increased red blood cell turnover, and sometimes through dietary changes that reduce heme iron intake.
When I look at the full picture, I do not see a body breaking down. I see a body adapting to a high training load.
The encouraging part is that ferritin appears to have stabilized. After a significant drop from 55 to 18, it held steady around the low 30s over the next six months despite continued running, strength training, and sauna use.
That suggests my current iron strategy is largely replacing ongoing losses, even if it is not yet rebuilding reserves.
The goal now is not simply to raise ferritin. It is to rebuild iron stores without sacrificing the habits that transformed the rest of my health.
Longevity is rarely about maximizing a single number.
It is about balancing the entire system.
Biological Age: One Step Back?
Function Health also nudged my biological age upward from 35.3 years old to 37 years old.
At first, that was disappointing. Then I remembered something important. Nearly six months have passed.
A 1.7-year increase over a 6-month period is not necessarily a meaningful deterioration, especially when nearly every major cardiovascular and metabolic marker remains excellent.
If anything, it is a reminder that biological age estimates are useful signals, not final judgments.

Building LabReady
One unexpected outcome of all this testing is that I kept getting confused about fasting requirements.
Function Health has one protocol.
WHOOP Advanced Labs has another.
Blueprint guidance can differ.
My healthcare provider has others.
Some tests require avoiding exercise. Others require fasting windows. Some involve supplement restrictions.
I found myself repeatedly asking:
When do I stop eating?
Can I drink tea with caffeine?
Should I pause creatine?
What about hydration?
So I built a solution.
I just released LabReady, a simple fasting timer for blood work prep.

After using a few different lab companies, I kept finding myself double-checking when to stop eating, pause green tea intake, hydrate, review supplements, avoid exercise, or follow specific test instructions.
LabReady turns those moving pieces into a clear prep timeline based on your lab appointment time.
It’s built for anyone tracking biomarkers, longevity labs, lipid panels, glucose, hormones, heavy metals, or routine blood work.
You can check it out here and please review the app with a simple star rating as it helps with app store discovery:
https://apps.apple.com/us/app/labready-fasting-tracker/id6774012579
Final Thoughts
At the start of this journey, my goal was simple:
Literally, don’t die.
Over time, the goal evolved.
Now I am learning that longevity is not about endlessly pushing harder. For me, it is more about balance.
The body keeps score, but given the right inputs, it also adapts.
Sometimes the next breakthrough is not doing more. It is recovering smarter.
The experiment continues. And for now, the data suggests I’m heading in the right direction.
Function Health Biomarker Results (May 2026)
🩺 Disclaimer
The content on I Won’t Die is for informational and educational purposes only. It is not a substitute for professional medical advice, diagnosis, or treatment. Always consult a qualified healthcare provider with any health concerns.
🚀 Get Started with Blueprint
Start optimizing your health today with $25 off your first order! Use our referral code to begin your Blueprint journey and take control of your longevity.
🏋️♂️ Track Your Sleep, Workouts & Recovery
Boost your performance and recovery with Whoop. Join with my referral link to get a free WHOOP 5.0 and one month free!
📲 Download the I Won’t Die App
Stay ahead with the latest news, updates, and insights. Download the I Won’t Die app now on the Apple App Store and Google Play!
📩 Contact Us
Have tips, photos, or questions? Want to collaborate? Reach out at [email protected] — we’d love to hear from you!
🔗 Stay Connected
Follow us on Don't Die, Facebook, X, Instagram, YouTube, and LinkedIn for Blueprint longevity and Bryan Johnson updates.
📬 Subscribe to I Won’t Die Newsletter
Get the latest longevity breakthroughs, Blueprint updates, and exclusive content straight to your inbox — sign up now!

The Foods That Help Me Eat Big and Stay 155 to 160 lbs

I’m Officially a Rejuvenation Olympian, Ranked #167 Behind Bryan Johnson

When More Exercise Stops Moving the Needle

I Took My Function Health Mid-Year Test: Now We Wait

Download the New I Won’t Die App: Longevity News, Biohacking Insights, and Health Tools

The Best Advice Bryan Johnson Has Ever Given

Stop Guessing Your Run: StayGreen Turns WHOOP Data Into Today’s Training Decision

Electrolytes: The Small Habit That Quietly Changed My Recovery

Mission Accomplished: My Speed of Aging Result Is In and Blueprint Confirms the Trend

Take Two: The Speed of Aging Redemption

Red Mode Is Live: Become a Professional Sleeper

Function Health January Labs: One Year Later

Blood, Biomarkers, and Beach Miles

Starting the Year Strong, Not From Scratch

How To Build Great Health One Boring Day at a Time

Bryan Johnson Shares Details of His HBOT Protocol for Longevity

Bryan Johnson Updates His Morning Routine Again: Here’s What’s New in May 2025

The Healthiest Lab Results Ever Recorded? Inside Bryan Johnson’s Longevity Bloodwork

Bryan Johnson Sat in a 200°F Sauna for 7 Days. Here’s What Changed

How Sauna Sessions Helped Bryan Johnson Eliminate 7 Harmful Toxins

How Strong Are Your Bones? Bryan Johnson’s Blueprint for Bone Health and Longevity

WHOOP MG Review: Improved Accuracy, New Features, and How WHOOP Age Compares to Blueprint’s Speed of Aging

Bryan Johnson’s 2025 Skincare Routine Revealed: How He Reversed His Skin Age by Decades

How Bryan Johnson Removed 93 Percent of Microplastics From His Blood

Inside Bryan Johnson’s 2025 Longevity Protocol and Why It Inspires Me

Don’t Die Podcast #3: Why Resting Heart Rate May Be the Most Powerful Health Metric for Sleep and Longevity

My Blueprint Advanced Panel Results: A Deep Dive into Longevity Biomarkers

The One Food Bryan Johnson Swears By for Longevity: Extra Virgin Olive Oil

How Bryan Johnson Gets Perfect Sleep Scores Every Night: A Blueprint for Deep Rest

Who Is the Healthiest Person in the World? This Man’s Data-Driven Life May Be the Answer
-

 Bryan Johnson Updates9 months ago
Bryan Johnson Has A Girlfriend: Finding The Person Who Feels Like Home And Why It Changes Everything
-
 My Longevity Journey10 months ago
WHOOP Advanced Labs: Understanding the Body Behind the Data
-

 Bryan Johnson Updates10 months ago
Sauna, Fertility, and Why This Matters More Than Ever
-
 My Longevity Journey11 months ago
How I Cut My ApoB by 51% Without Medication